
Products / Rental Property Deal Analyzer
Put the rentals you are considering side by side.
Type each property's price, loan, rent and running costs into one column. The Compare tab works out the same measures for all of them and checks each one against the targets you set.
Who it's for
Small landlords and first-time investors weighing up to 10 potential purchases with their own figures.
It does the arithmetic. It makes no buy or sell call: the targets are yours, and so is the decision.
A look at the actual file
What's inside
One workbook, 7 tabs, in this order.
| Tab | What it does |
|---|---|
| Start here | Five-step how-to, colour key and the checks status. |
| Deals | One column per property: price, closing costs, rehab, down payment, rate, term, rent, vacancy, tax, insurance, HOA, maintenance, CapEx, management and utilities. |
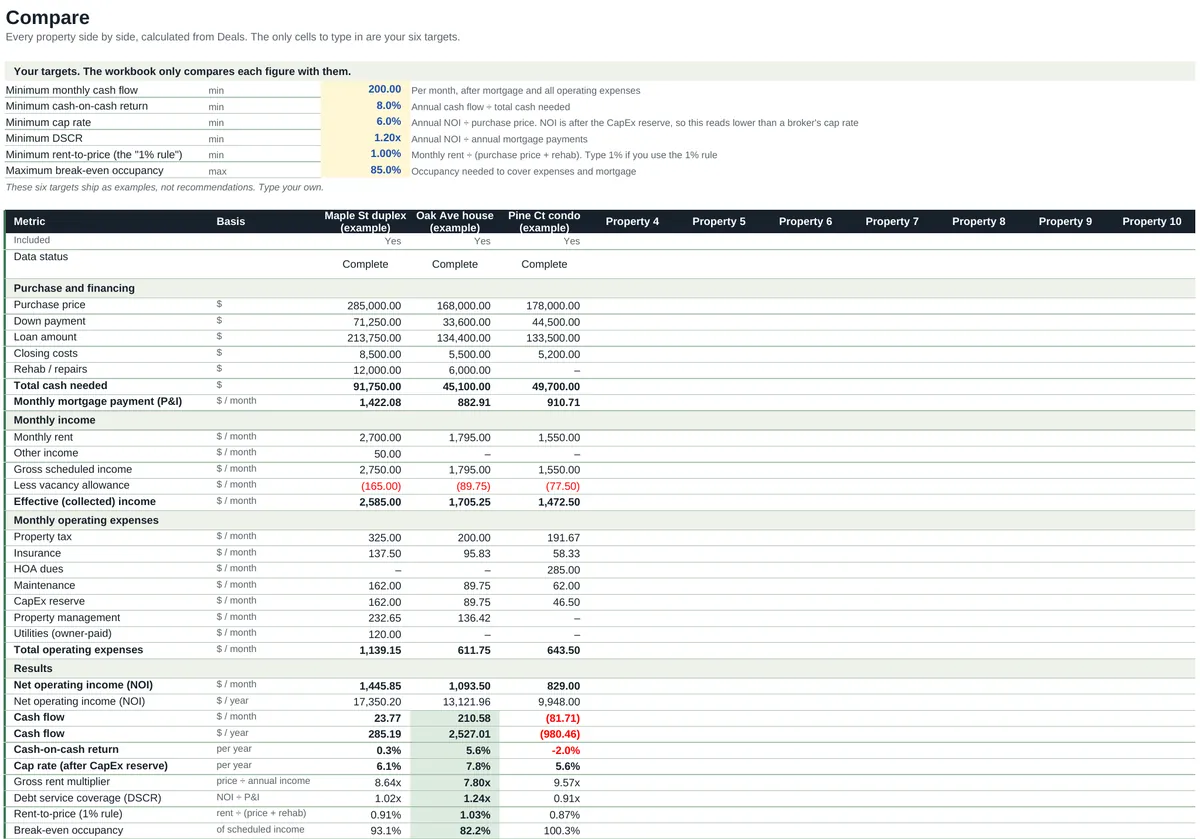
| Compare | Every property side by side: mortgage payment, NOI, cash flow, cash-on-cash, cap rate, gross rent multiplier, DSCR, rent-to-price, break-even occupancy and cash needed. Your own targets sit at the top. |
| Analysis | One property in detail, monthly and annual. |
| Projection | Ten years for the selected property using your own rent growth, expense growth and appreciation rates, with a chart. |
| Sensitivity | Monthly cash flow across 7 rent levels and 7 interest rates. |
| Checks | Input and consistency checks over every figure you type, which should all say OK. |
A look at the file
| Measure | Maple St duplex | Oak Ave house | Pine Ct condo |
|---|---|---|---|
| Purchase price | 285,000.00 | 168,000.00 | 178,000.00 |
| Total cash needed | 91,750.00 | 45,100.00 | 49,700.00 |
| Monthly rent | 2,700.00 | 1,795.00 | 1,550.00 |
| Results | |||
| Cash flow per month | 23.77 | 210.58 | (81.71) |
| Cash-on-cash return | 0.3% | 5.6% | -2.0% |
| Cap rate | 6.1% | 7.8% | 5.6% |
| Debt service coverage (DSCR) | 1.02 | 1.24 | 0.91 |
| Rent-to-price (1% rule) | 0.91% | 1.03% | 0.87% |
| Break-even occupancy | 93.1% | 82.2% | 100.3% |
| Your targets met | 1 of 6 | 5 of 6 | 0 of 6 |
The file ships with example targets (for example, at least 200.00 a month cash flow and a DSCR of 1.2). They are placeholders, not recommendations: replace them with your own. The count only says how each property compares with the numbers you typed.
Format
- File
- 1 Excel workbook (.xlsx), 7 tabs
- Software
- Microsoft Excel. Designed to open in Google Sheets.
- Limits
- 10 properties. Three example properties, marked (example), to overwrite or delete.
- Delivery
- Instant download after purchase. Nothing is shipped.
- Price
- US$9.99, one-time. Launch price until 15 Nov, then US$14.99. No subscription.
What it does not do
- It makes no buy or sell recommendation. Results depend entirely on the figures you enter.
- Figures are before tax: no depreciation, income tax or capital gains.
- It is not investment advice. Check your numbers with a qualified professional before you decide.
Questions
Which version of Excel do I need?
Excel 2010 or later on Windows, Excel 2016 or later on Mac, or Excel for the web. We checked every formula in this workbook against the version of Excel that first supported it: the newest thing it uses arrived in Excel 2007, so it needs no Microsoft 365 subscription. There is nothing in it that only newer Excel can run, such as XLOOKUP, LET, IFS or TEXTJOIN, and there are no macros or add-ons. Excel 2003 and earlier are not supported.
The totals look blank when I open it. What is wrong?
Nothing. Excel opens a downloaded file in Protected View and does not calculate until you click Enable Editing. The figures appear as soon as you do.
Does it work on a Mac?
Yes, in Excel for Mac. There are no macros, so nothing in the file is Windows-only. It is also designed to open in Google Sheets in a browser.
Can I use it in Google Sheets?
The workbook is made in Excel and designed to open in Google Sheets: upload it to Drive and open it with Google Sheets. It uses no macros, scripts or add-ons. If something does not work as described there, email hello@goodcolumns.com and we fix it or refund you.
What if I want a refund?
No change-of-mind refunds on digital files. If a file is faulty or not as described, email hello@goodcolumns.com within 30 days and we fix it or refund you.
Is this tax, legal or financial advice?
No. It does the arithmetic on the figures you enter and compares them with targets you set. It makes no buy or sell call and is not investment advice.
The small print
Good Columns templates help you organise records. They are not tax, legal, accounting or financial advice, are not endorsed by the IRS or any government body, and may not suit your situation. You are responsible for the figures you enter.
The Deal Analyzer is not investment advice and makes no buy or sell call. Results depend entirely on the figures you enter.
Licence: use within your own business; no resale or redistribution.
No change-of-mind refunds on digital files. If a file is faulty or not as described, we fix it or refund you.
Full terms: Terms and refunds.